Build performance profile
Rspack Profile
The Rspack CLI supports the use of the RSPACK_PROFILE environment variable for build performance profile.
This command will generate a .rspack-profile-${timestamp}-${pid} folder in the current folder, and it will contain logging.json, trace.json and jscpuprofile.json files.
trace.json: The time spent on each phase of the Rust side is recorded at a granular level using tracing and can be viewed using ui.perfetto.devjscpuprofile.json: The time spent at each stage on the JavaScript side is recorded at a granular level using Node.js inspector and can be viewed using speedscope.applogging.json: Includes some logging information that keeps a coarse-grained record of how long each phase of the build took
Rsdoctor's Compilation Analysis
Rsdoctor is a build analyser that can visually display the compilation time of each loaders and plugins.
Loader Timeline
If you need to analyze the time cost of loaders and plugins, or the compilation behavior of loaders, you can use Rsdoctor to view:
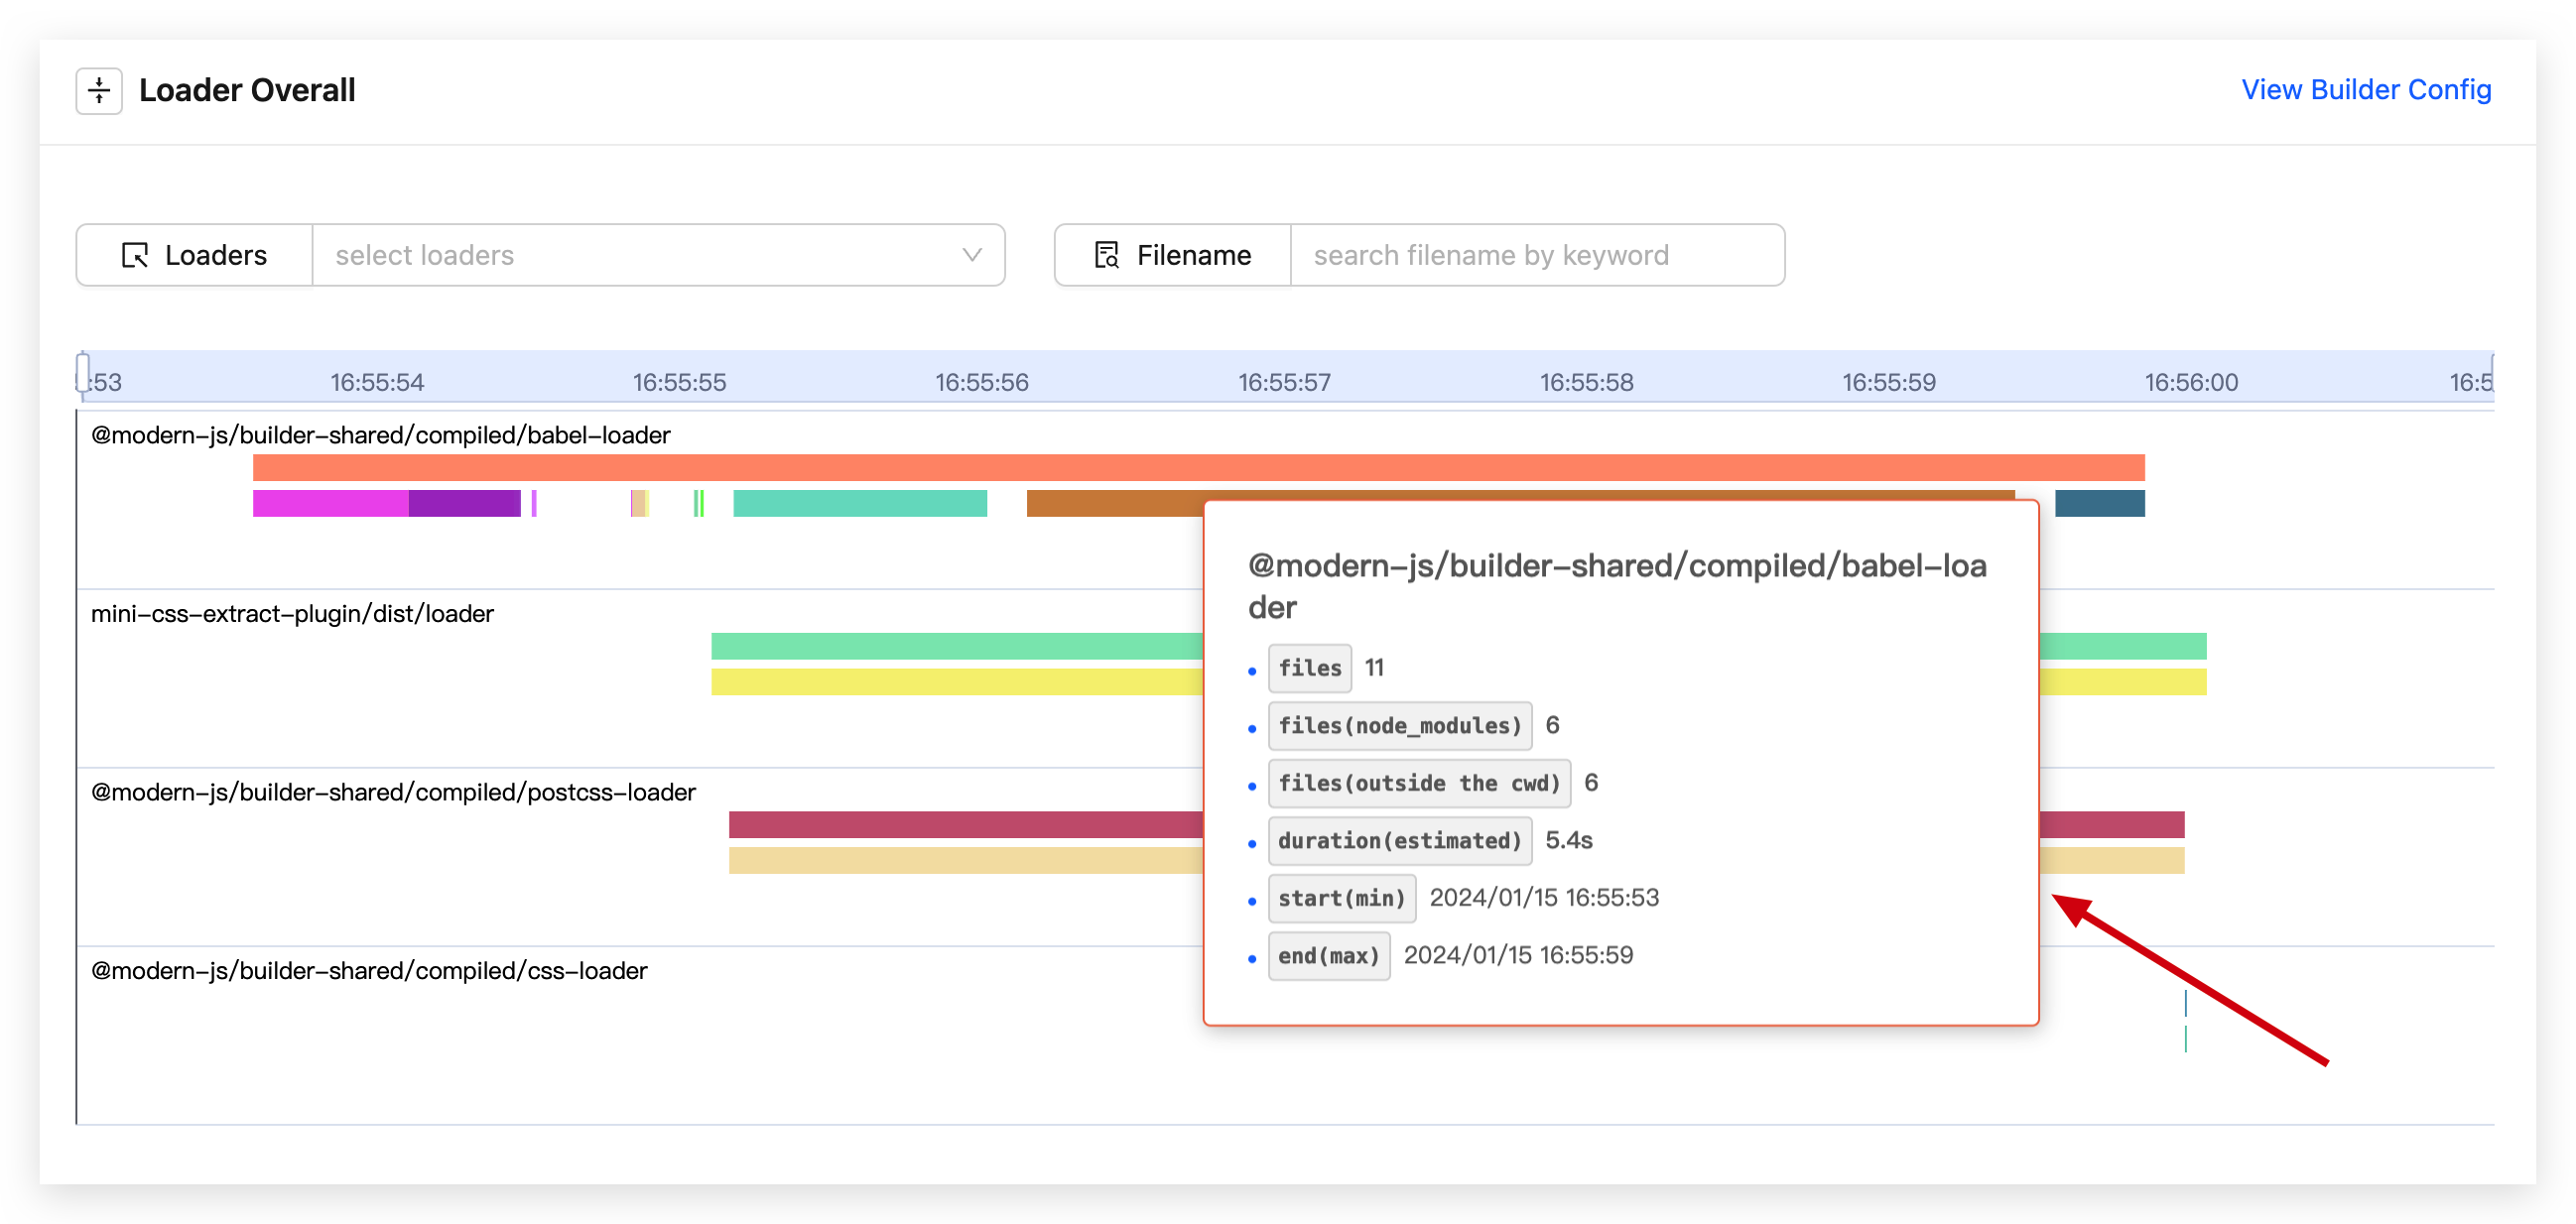
You can view the execution time of each loader and the files that were compiled, as well as the time taken for each file, in the timeline.
Refer to Loader Timeline.
Loader Details
If you want to view the compilation process of loaders, you can use the Loader Details:
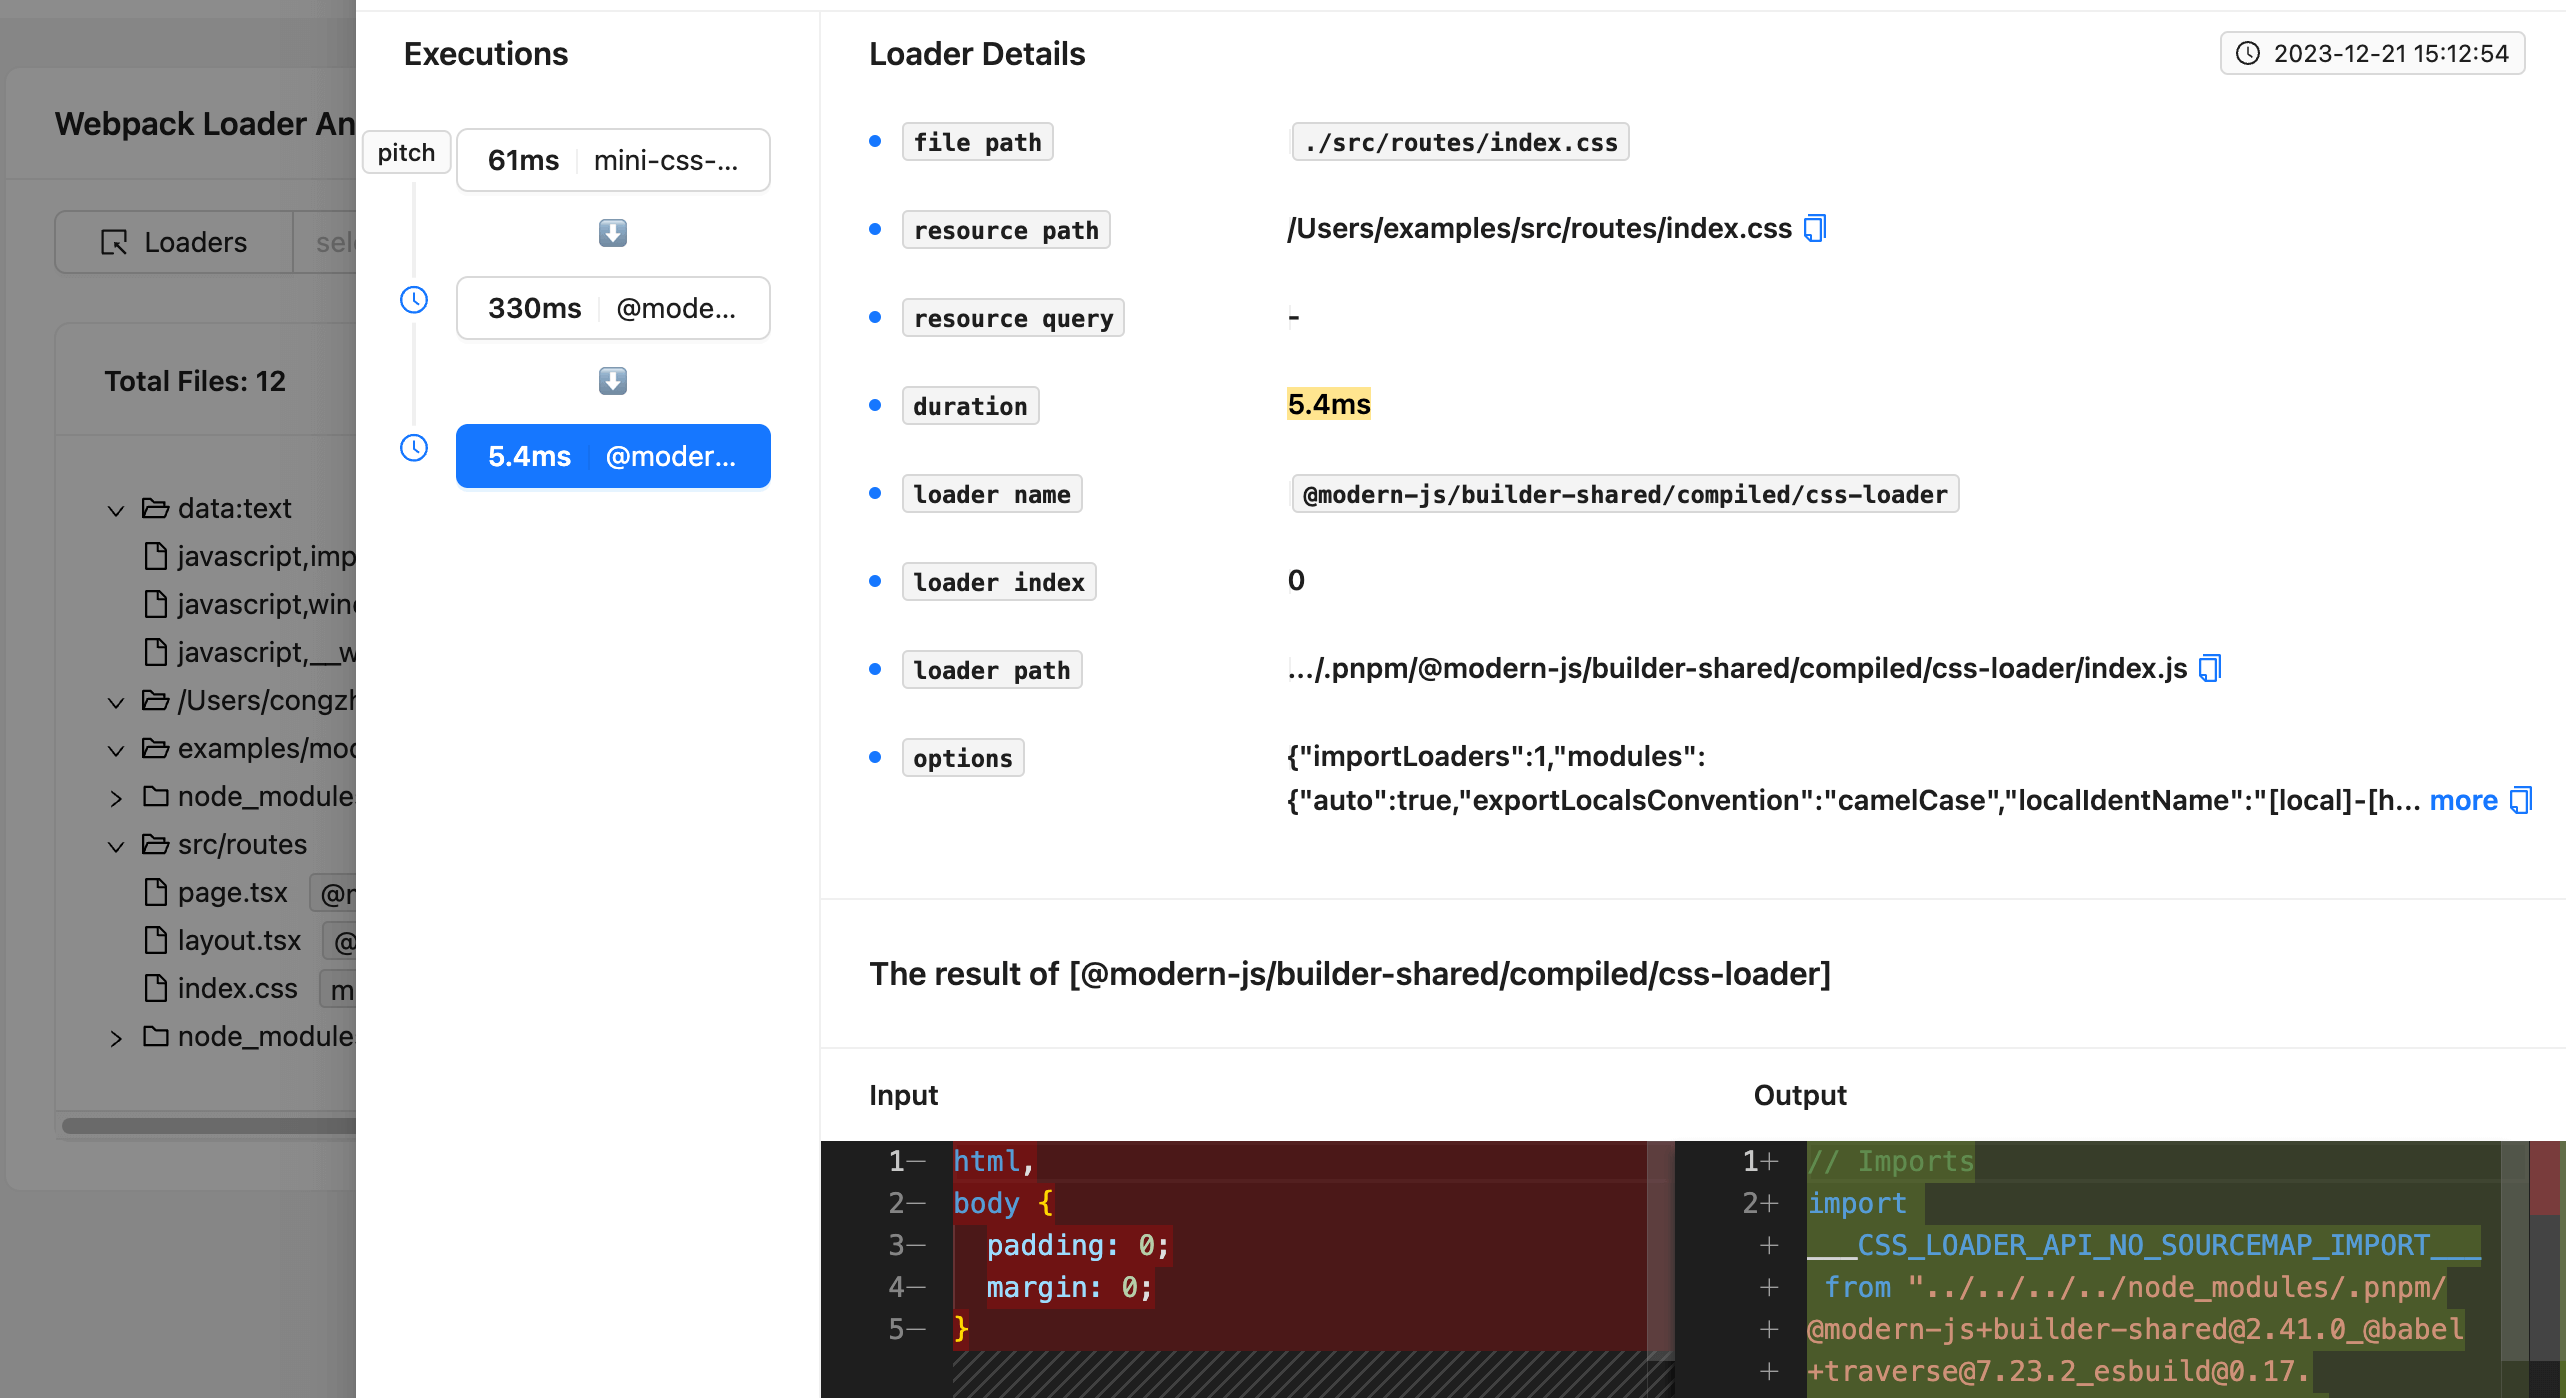
On this report page, you can see the code changes made by the loaders for each file before and after compilation.
Refer to Loader Details.
Enable Compilation Analysis
To enable RsdoctorRspackPlugin, you can refer to the documentation: Use Rsdoctor.
- The
RsdoctorRspackPluginrequires thefeatures.loaderandfeatures.pluginsparameters to be set totrue. By default,features.loaderandfeatures.pluginsare enabled. Refer to the parameter documentation Rsdoctor options. - Usage documentation:
- For Loader Analysis, refer to Loader Timeline and Loader Details.
- For Plugins Analysis, refer to Plugin Analysis.